Data Analytics tools are a sophisticated and more technologically inclined form of extracting this information to implement business decisions. Over 59% of the businesses in the world use big data analytics.
Martin Movasatte, CEO and Founder of Heap Analytics, says,
“Analytics software is uniquely leveraged. Most software can optimize existing processes, but analytics (done right) should generate insights that bring to life whole new initiatives. It should change what you do, not just how you do it.”
Read on to find out the 13 best analytics tools and how they can change what an organization does.
1. Tableau
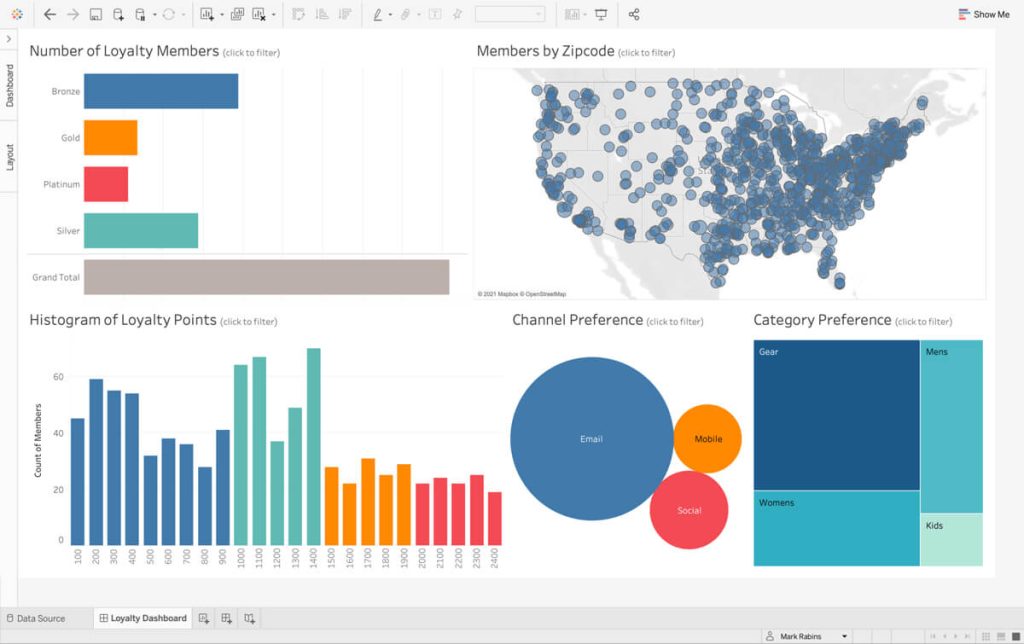
Tableau is a data visualization and analytics platform that enables users to generate and distribute reports across mobile and PC and within a browser or embedded within an application. It can be run in either cloud or on-premises.
The Tableau platform is built around its primary query language, VizQL. Drag-and-drop dashboard and visualization components are converted into efficient back-end queries and reduce end-user performance optimization requirements.
2. Excel
With 750 million users, Microsoft Excel is the most commonly utilized platform for developing spreadsheets and conducting analyses. Excel can support practically any conventional analytics process and is expandable via its native programming language, Visual Basic.
Excel is suitable for simpler analysis, but it is not appropriate for analyzing large amounts of data (a limit of 1 million rows). It does not allow collaboration or version control well. Hence, larger organizations should explore more sophisticated cloud-based analytics tools.
3. Python
Python, a high-level programming language, is open source and widely used by technical analysts and data scientists. Python is capable of performing a wide range of studies on its own and integrating with third-party tools for machine learning and data visualization.
Since its introduction, Python has been one of the most popular programming languages. The key reason for its popularity is that it is a simple language to learn that is also incredibly fast.
However, with the introduction of analytical and statistical libraries such as NumPy, SciPy, and others, Python has evolved into one of the most sophisticated data analytics tools. It now covers a wide range of mathematical and statistical functions.
4. R
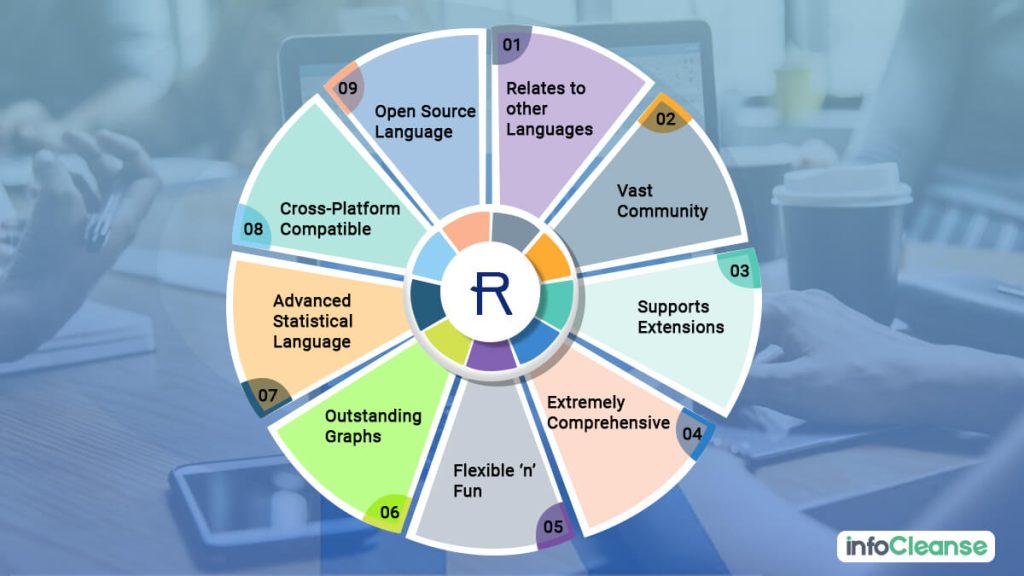
R is a computing environment and programming language that is open source and centers on statistics and graphical data visualizations. R includes a wealth of graphical tools and over 15,000 open source packages, many of which are useful for importing, manipulating, modeling, and visualizing data. Technical analysts with programming abilities can develop almost any form of data analysis using R.
R is one of the most popularly used analytics tools. It has grown in strength over the years and performs well even with massive data sets. It has also become much more adaptable and can interface seamlessly with a wide range of Big Data platforms.
5. Microsoft Power BI
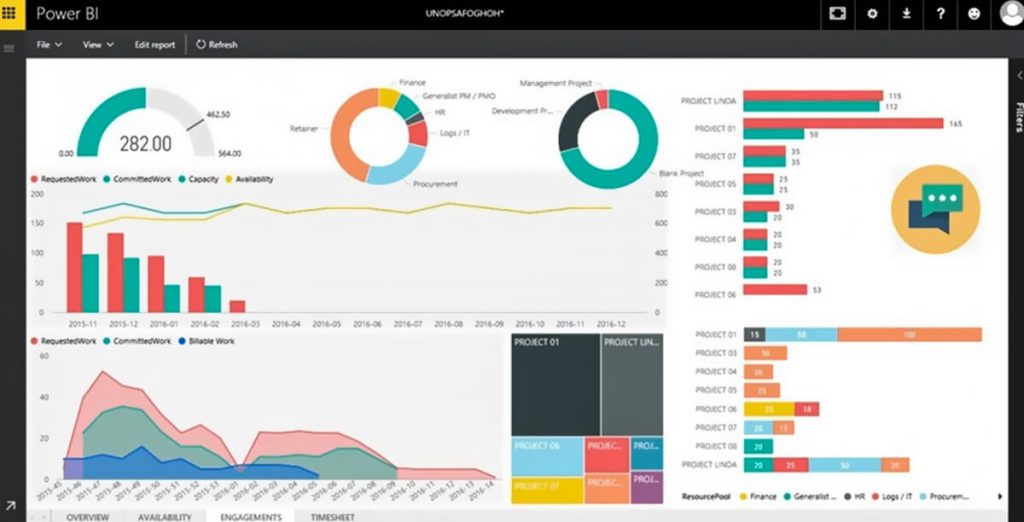
Microsoft Power BI is a crucial business intelligence software that supports a wide range of data sources. Users can use this data analytics software to build reports, displays, and dashboards and then publish them for easy dissemination. Users may also utilize Power BI to create automated machine learning models by connecting to Azure Machine Learning.
6. Google Data Studios
Google Data Studio is a free tool used for dashboarding and data visualization that interfaces with other Google apps, including Google Analytics, Google Ads, and Google BigQuery. Since it interfaces with other Google services, Google Data Studio is ideal for companies that require evaluation of their Google Data.
Data Studio can operate with data from multiple sources as long as the data is initially copied to BigQuery via a data pipeline.
7. IBM Cognos
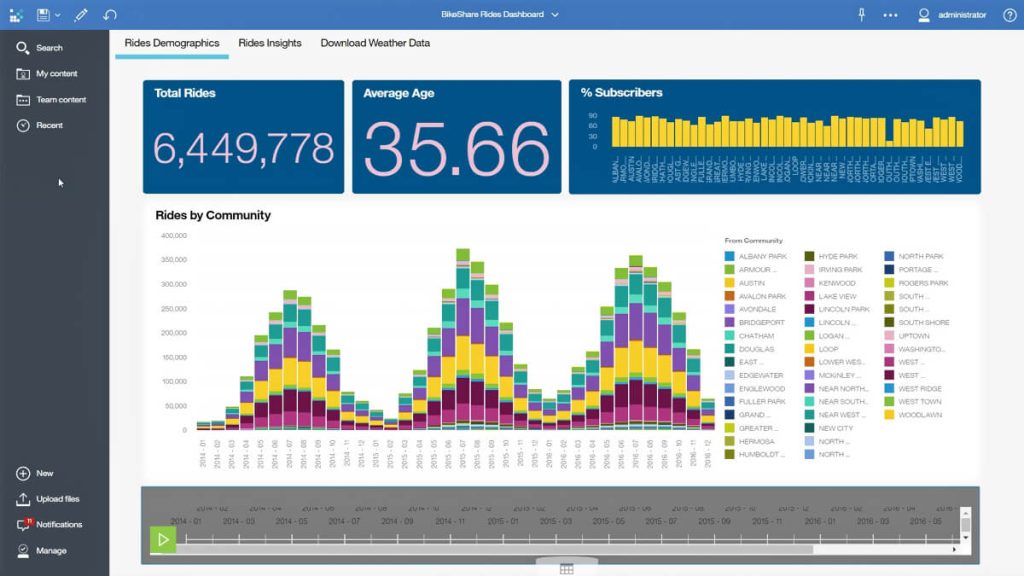
IBM Cognos is a business intelligence tool with built-in AI algorithms that identify hidden insights in data and explain them in plain language. Cognos also provides automated data cleansing tools for automatically cleansing and aggregating data sources, allowing for rapid integration and experimentation with data sources for analysis.
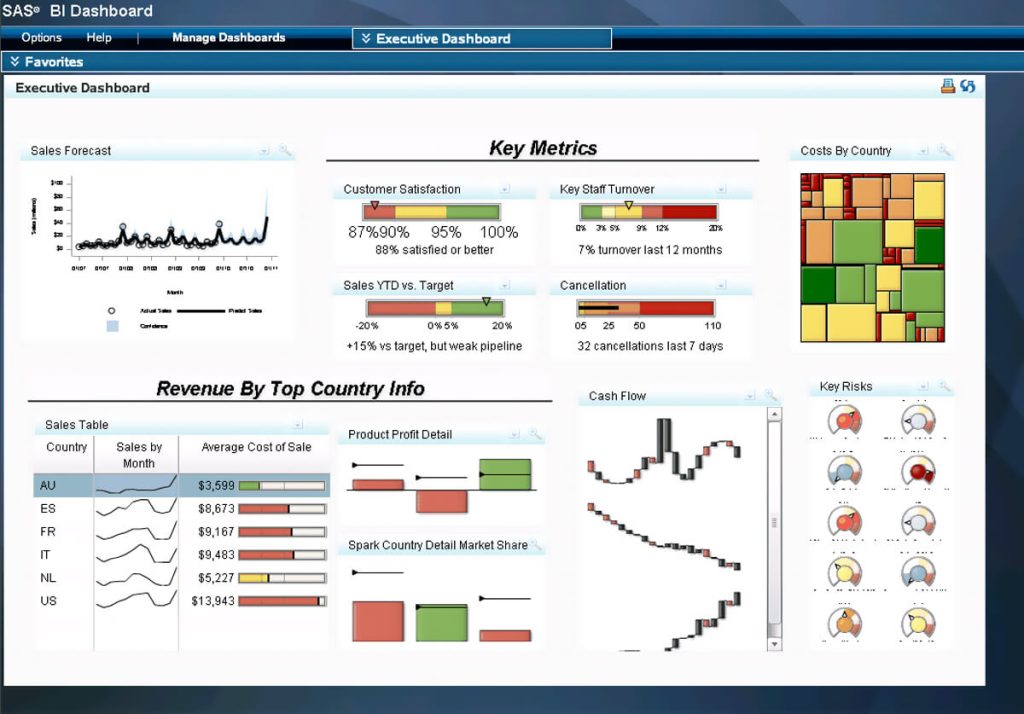
SAS Business Intelligence offers a spectrum of self-service analytics tools. It has several collaborative capabilities built-in, such as the ability to push findings to mobile apps. While SAS Business Intelligence is a robust and adaptable platform, it is pricier than its counterparts. Its adaptability makes it more suitable for larger businesses as they may find it worthwhile to pay the price.
8. SAS Business Intelligence
9. Zoho Analytics
For in-depth reporting and data analysis, Zoho Analytics is an excellent Business Intelligence solution. It has automated data syncing that can be scheduled regularly. Some of its other advantages are:
- Creating connectors by utilizing the integration APIs.
- Producing meaningful reports by blending and merging data from many sources.
- Making personalized reports and dashboards to help focus on the key details.
- Features a unique comment box that is ideal for collaboration.
10. RapidMiner
RapidMiner includes all technologies required to combine, clean, and transform data before running statistical models and predictive analytics. Almost all of this can be done using a simple graphical interface.
RapidMiner can also be expanded with R and Python scripts and other third-party plugins available on the company’s platform.
11. Sisense
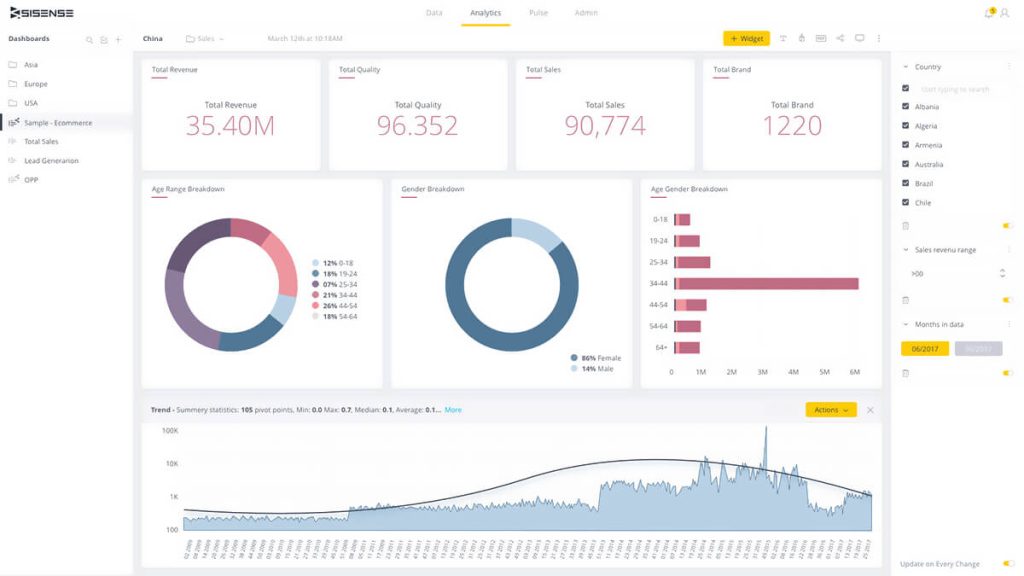
Sisense is a user-friendly business analytics solution that enables anyone inside an organization to manage vast and complicated datasets as well as analyze and visualize this data without the intervention of an IT department.
It combines data from various sources, including Adwords, Google Analytics, and Salesforce. Since it uses in-chip technology, data is processed much more quickly than with other tools.
12. Jupyter Notebook
Jupyter Notebook, formerly known as IPython Notebook, is a comprehensive free, open-source online Data analytics tool that can be administered in a browser following installation using the Anaconda platform or Python’s package management pip.
It allows developers to create reports using Live Code Data and views. This data analytics application is compatible with over 40 programming languages. It enables developers to access Python’s extensive analytics and visualization packages.
13. Oracle Analytics Cloud
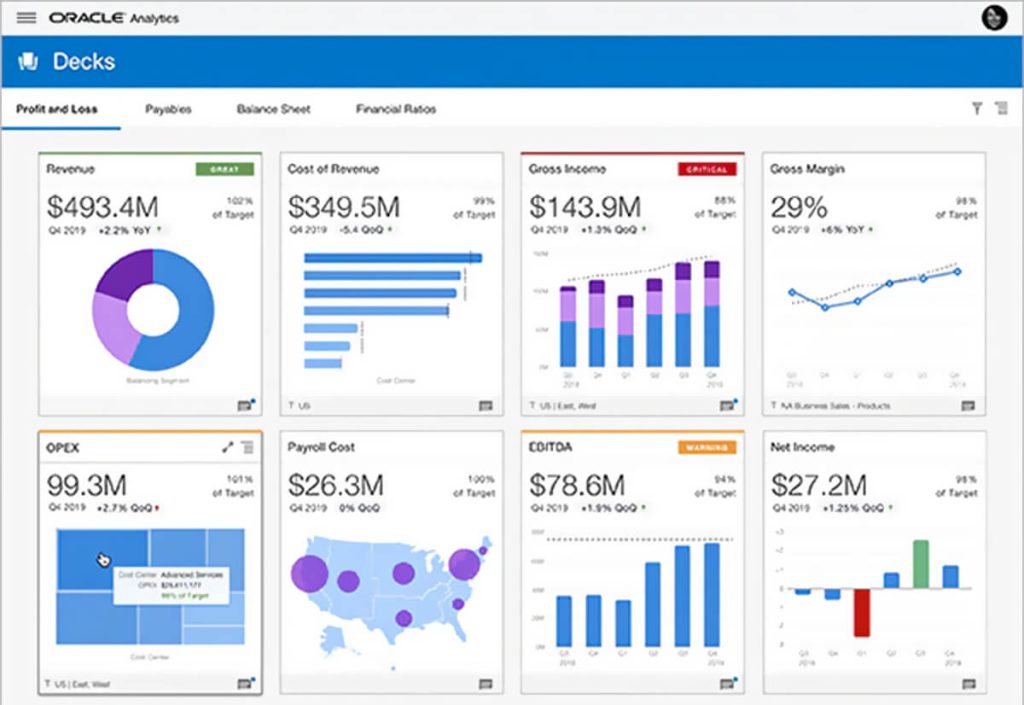
Oracle Analytics Cloud is a cloud-based business intelligence and data analytics product package. Its primary goal is to assist large organizations in transforming their antiquated systems onto a digital cloud platform.
Users can acquire Data insights from a wide variety of analytical features, ranging from basic visualizations to Machine Learning algorithms.
Final Thoughts
This article has listed the uses of more popular analytics tools like Excel and Tableau as well as more premier tools like SAS Business Intelligence. These tools are easy to use, and some don’t even require the assistance of an IT team.
Further, one can choose from a range of free and subscription-based services depending on the purpose they require their analytics tool to serve.
An organization essentially only has to choose from this varied range of competitive software based on their requirements.